

Every article in this series ends with a decision: a ground-motion map, a robotic grasp, an alert. Between the raw image and that decision sits a quieter step, turning pixels into features a model can reason about. Get this step wrong and nothing downstream recovers: garbage in, garbage out.
Features and feature vectors
A feature is any measurable property of an image: colour, an edge, a corner, a texture. Stack enough of them together and each image becomes a feature vector, a list of numbers that a machine-learning model can compare, cluster and classify. Good features are distinctive and repeatable; weak features limit the model no matter how powerful it is.
Histograms: statistics as a descriptor
One of the simplest useful features is the histogram, a count of how often each value appears. A greyscale histogram reveals whether an image is over- or under-exposed; the Histogram of Oriented Gradients counts edge directions to describe shape. Histograms can be global or local, and they compress an image into a compact, comparable signature.
A histogram also drives thresholding: choosing a cut-off value along those counts separates foreground from background, the first step in segmentation and edge detection. The hard part is generalisation: a threshold that works on one image rarely transfers unchanged to the next, which is why adaptive, data-driven thresholds matter.
Colour scales carry meaning
In remote observation the colours themselves are data. A false-colour scale maps an invisible quantity onto something the eye can read.
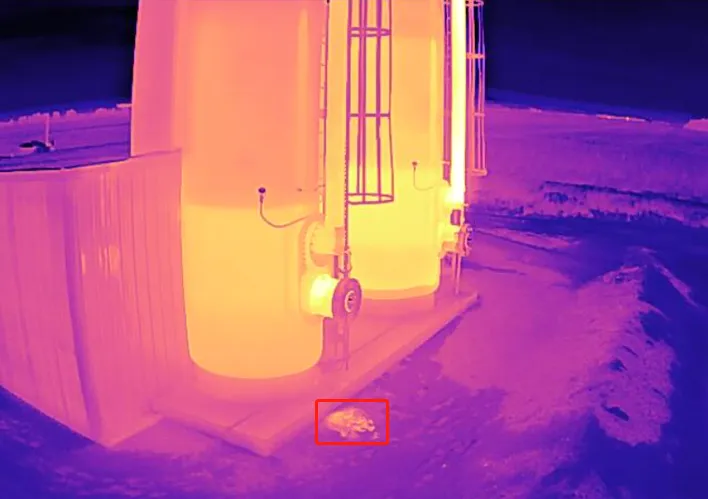
In a thermal image, warmer reds, oranges and yellows mark heat; cooler purples and blues mark cold. The colour scale is the measurement.
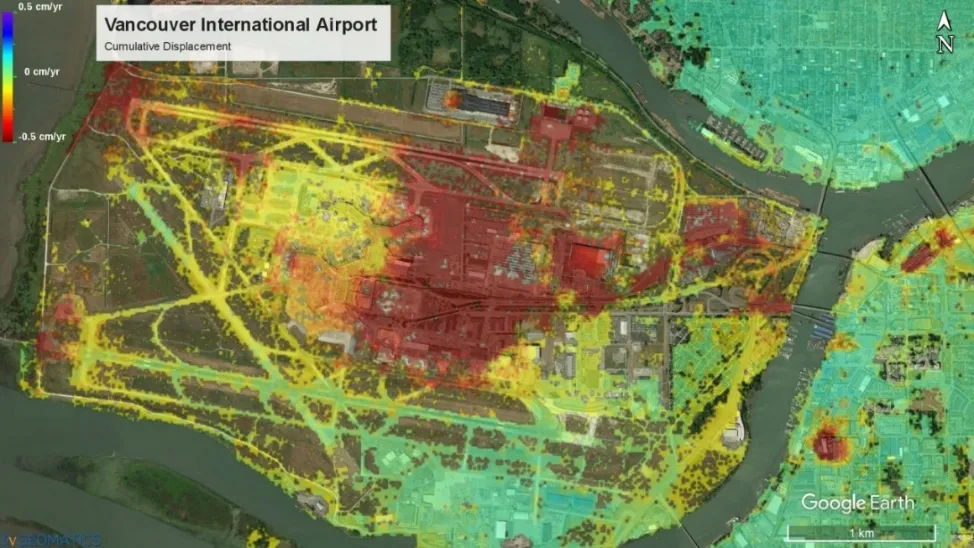
The same principle in InSAR: colour encodes cumulative ground deformation across an airfield, so a whole region’s movement can be read at a glance. InSAR imagery courtesy 3vGeomatics.
Reading these scales correctly is where remote observation becomes quantitative. The colour is not decoration; it is the answer, and the rest of the pipeline depends on measuring it, not just seeing it.